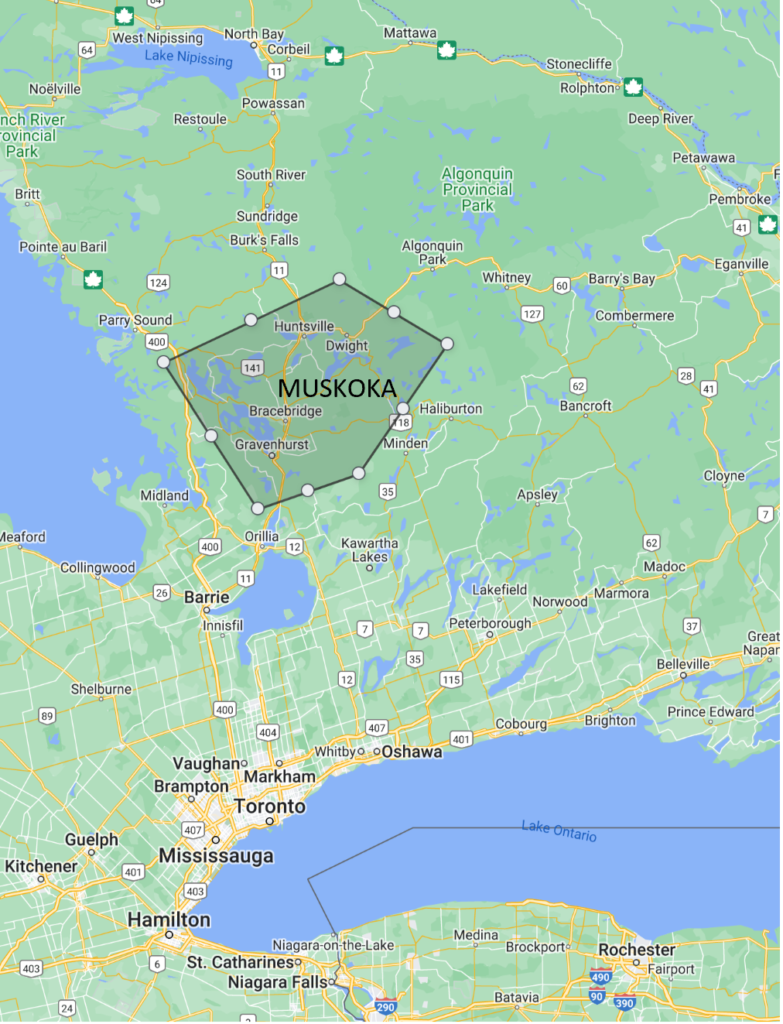
Muskoka Market Conditions: The median residential sale price in the District of Muskoka decreased by approximately 5.17% during the 12 months previous to July 1, 2023 compared to the 12 months previous to July 1, 2022. Sales of vacant land and/or commercial property were not included in the data source.
Area included in source data: District of Muskoka, residential waterfront and residential non-waterfront improved sales only. (Source: Lakelands Association of Realtors MLS data)
Disclaimer: The above data was provided for personal use only and was obtained from sources considered reliable and was not verified. It is up to the reader of this information is to determine the suitability and use of the information. Any and all liability to the reader is expressly denied.
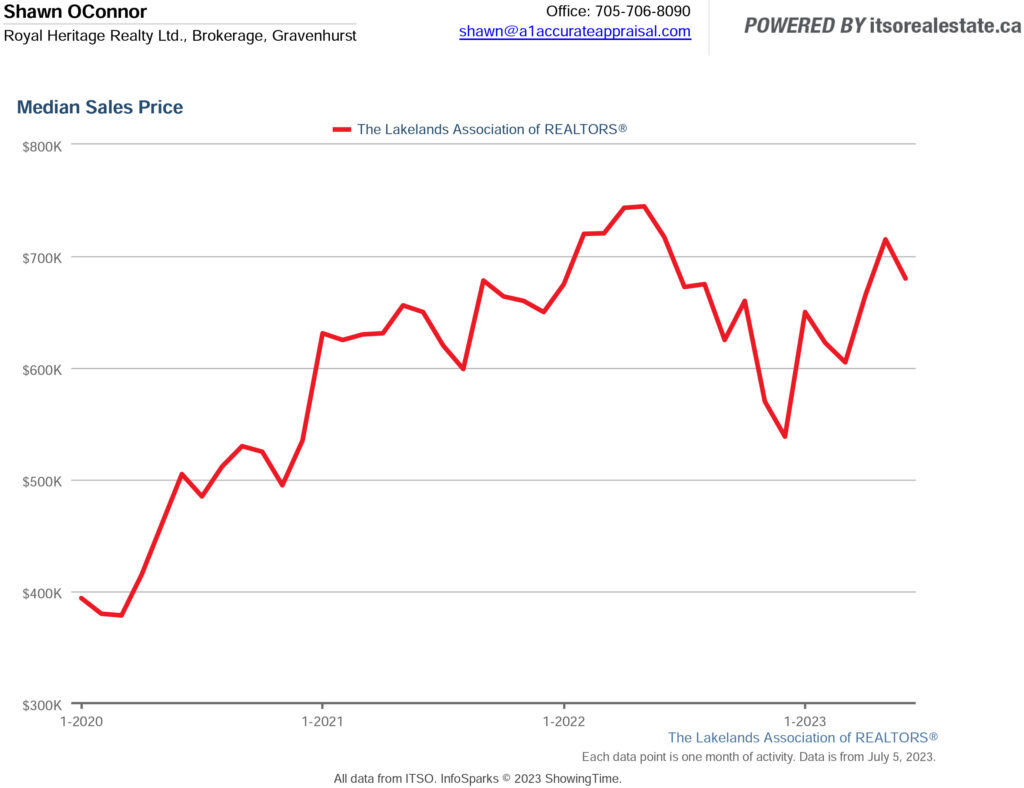
The aggregate median sale price for waterfront and non-waterfront property together has recently been declining and was $680,000 as at July 1, 2023. (12 month rolling aggregate median price). Both waterfront and non-waterfront home prices have declined last month.
May 2023: The Canada real estate market continues to show signs of a rebound, with home sales up by double digits month-over-month. According to the Canadian Real Estate Association (CREA), national home sales rose 11.3% as of last measure, marking the third consecutive month that home sales grew, and the strongest monthly gain in nearly three years. While buyers have returned to the market, the rise in mortgage interest rates over the last year has kept many current homeowners on the sidelines, with new listings up 1.6% month-over-month.
New Listings increased 15.0 percent for Waterfront homes but decreased 3.2 percent for Non-Waterfront homes. Sales decreased 2.5 percent for Waterfront homes but increased 2.9 percent for Non-Waterfront homes. Inventory increased 56.6 percent for Waterfront homes and 41.8 percent for Non-Waterfront homes.
Median Sales Price decreased 2.6 percent to $950,000 for Waterfront homes and 3.7 percent to $681,500 for Non-Waterfront homes. Days on Market increased 93.8 percent for Waterfront homes and 106.7 percent for Non-Waterfront homes. Months Supply of Inventory increased 153.1 percent for Waterfront homes and 121.7 percent for Non-Waterfront homes.
Buyer demand continues to outpace supply, which remains at a two decade low, causing sales prices to increase for the second straight month. According to CREA, the Aggregate Composite MLS Home Price Index (HPI) rose 1.6% month-over-month as of last measure, with the national average sales price up more than $100,000 since January. Although home prices remain down compared to last year, recent increases could help bring prospective sellers back to the market, many of whom have been delaying the decision to sell until market conditions shift in their favor.
For more information about the Muskoka market contact A1 Accurate Appraisal, 3-200 Manitoba St., Suite 329, Bracebridge, ON, Canada, P1L 2E2