2024-2-1 Newsletter: Muskoka Home Sales, Real Estate Trends

By Shawn OConnor, AACI, Hon. B. Comm.

Muskoka Market Conditions
 February 24, 2024

WATERFRONT PROPERTY ONLY: The median sale price fluctuated during 2023 and reached a high of $925,000 in May, 2023 and a low of $847,000 in January of 2024. The median price data only included waterfront properties sale prices.

Area included in source data for Muskoka home sales: District of Muskoka, residential waterfront improved sales only. (Source: Lakelands Association of Realtors MLS data)

Disclaimer: The above data was provided for personal use only and was obtained from sources considered reliable and was not verified. It is up to the reader of this information is to determine the suitability and use of the information. Any and all liability to the reader is expressly denied4

Quick facts
Muskoka Map, Ontario, Canada
Muskoka waterfront sale prices, February 2024
Muskoka, Ontario, Canada - cottage sale prices.
2023 Muskoka cottage sale prices
During 2023 the median cottage sale price declined from its highest in May 2023 to the lowest in January 2024. a difference of 8.43%

Muskoka Home Sales

Muskoka Median Sale Price
Inventory of Homes for Sale
Percent of List Price Received
January 2024
National home sales rose 8.7% month-over-month and 3.7% year-over year, according to the Canadian Real Estate Association (CREA), snapping a six-month streak of declines and marking one of the stronger periods of home sales since last spring and summer. Despite the end-of-year boost in activity, annual home sales came in at 443,511 units in 2023, a decline of 11.1% from the previous year. CREA remains optimistic about the market going forward, forecasting residential sales will increase 10.4% annually to about 490,000 units in 2024.

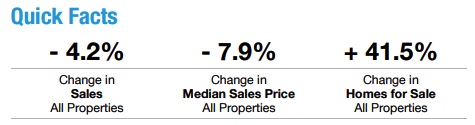
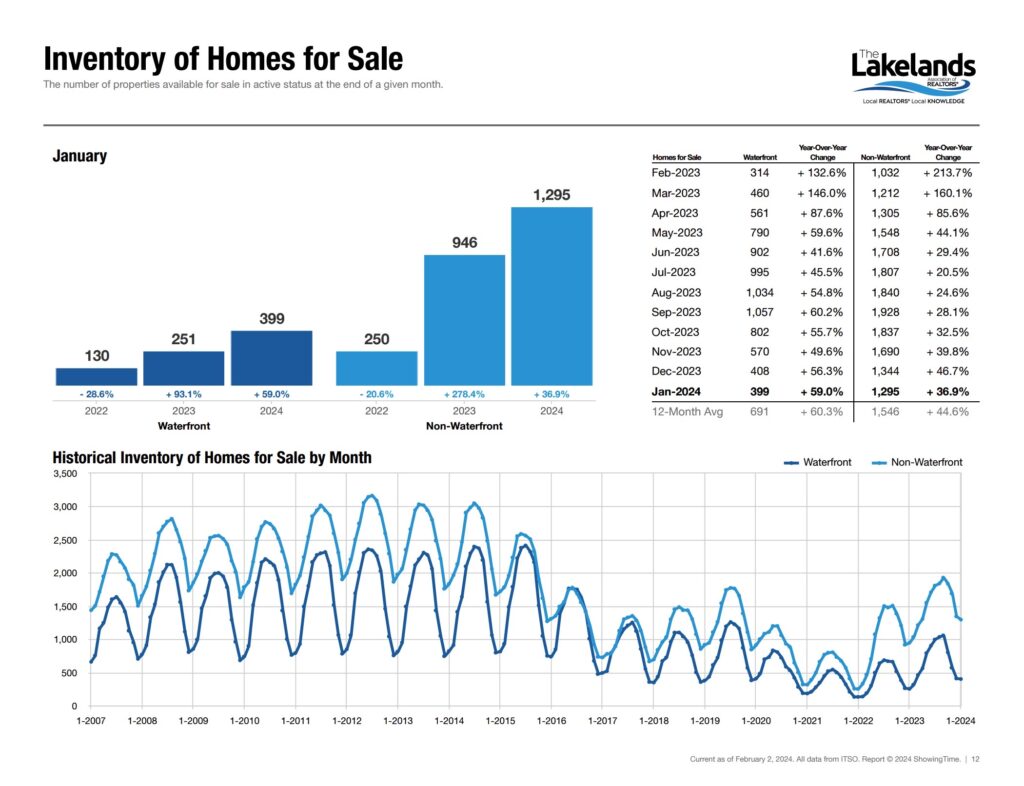
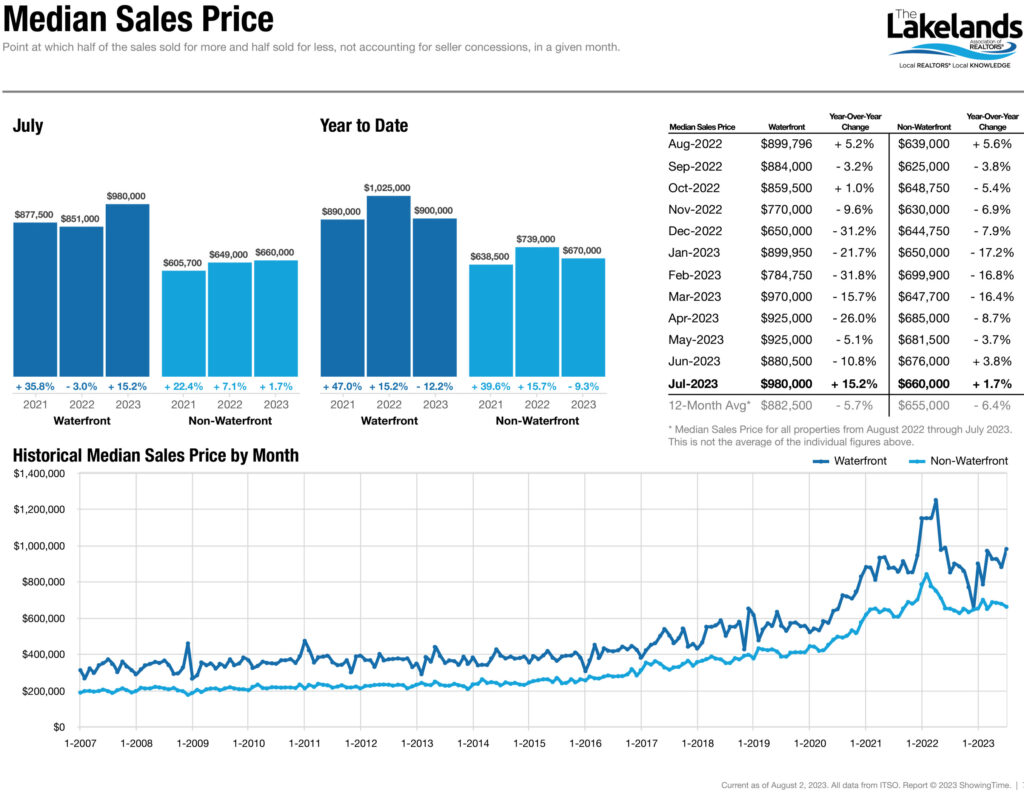
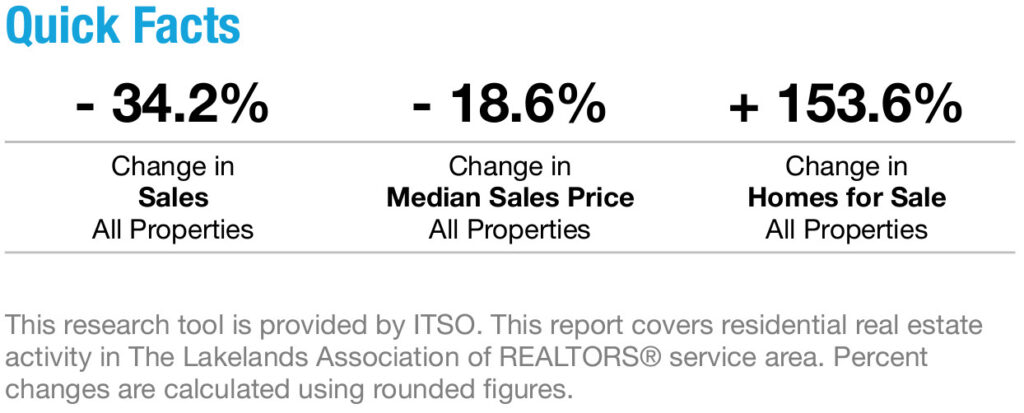
New Listings increased 46.8 percent for Waterfront homes and 5.5 percent for Non-Waterfront homes. Sales decreased 29.4 percent for Waterfront homes but increased 0.5 percent for Non-Waterfront homes. Inventory increased 59.0 percent for Waterfront homes and 36.9 percent for Non-Waterfront homes.

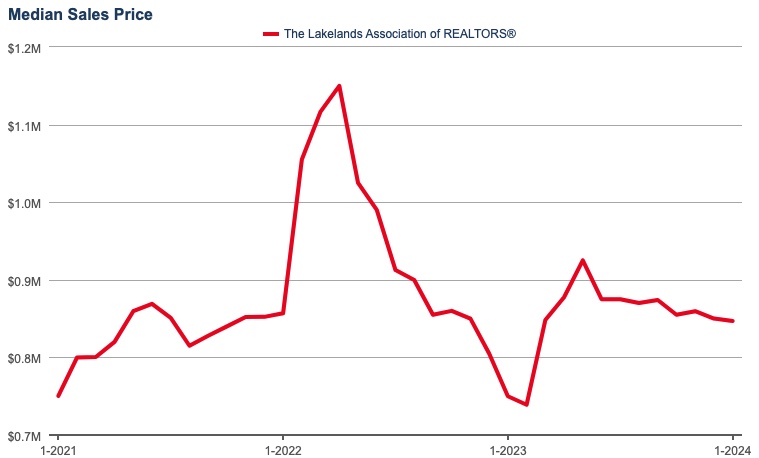
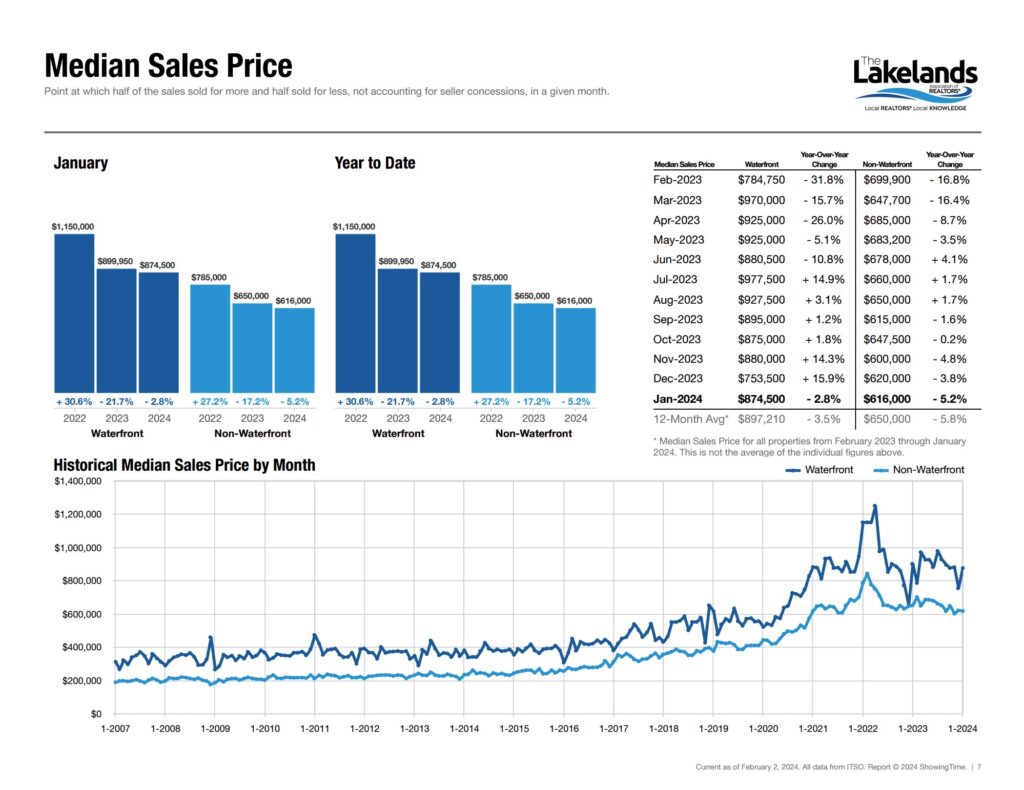
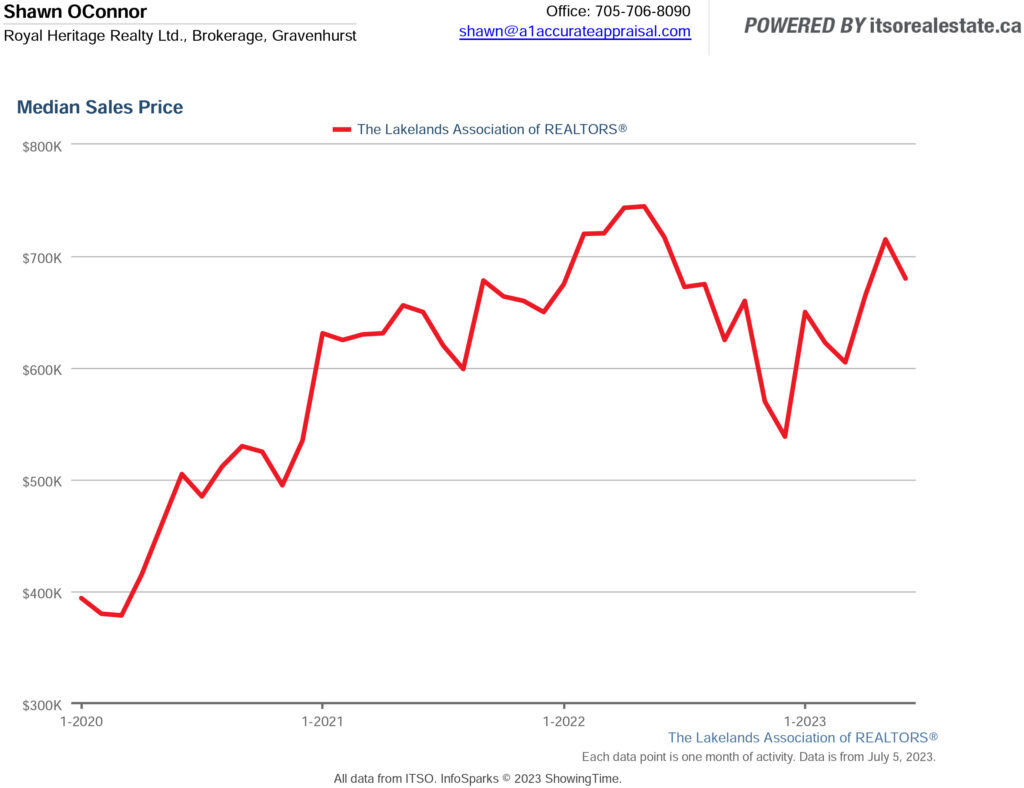
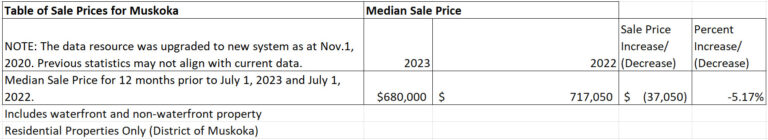
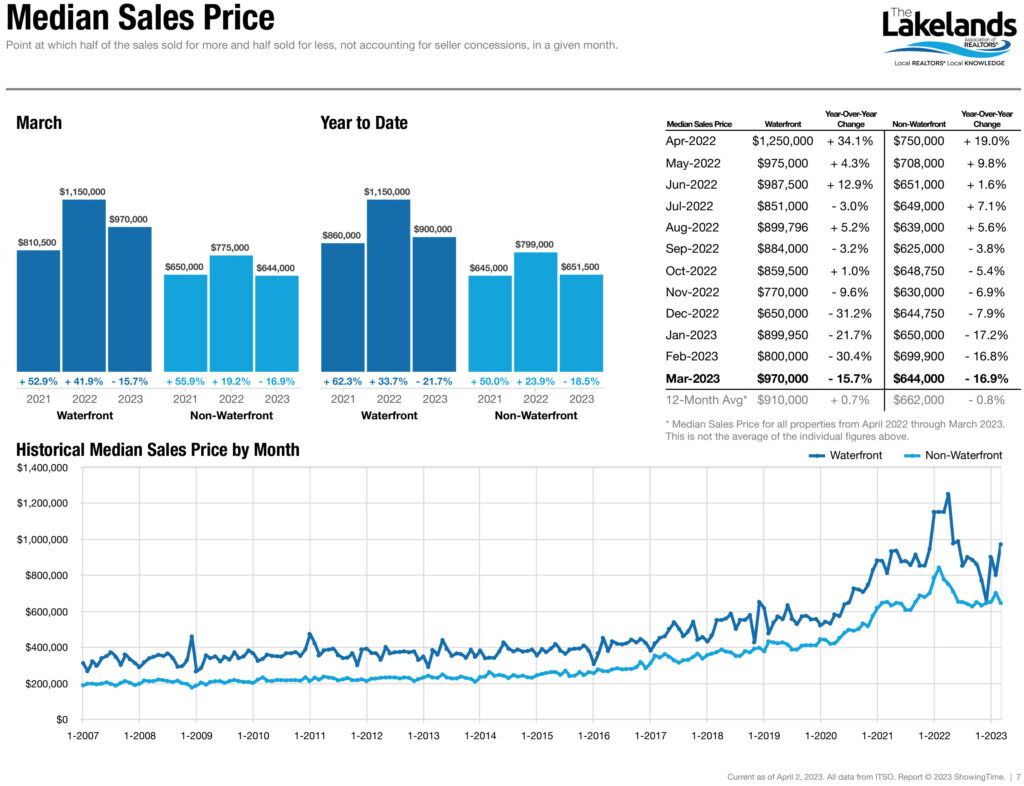
Median Sales Price decreased 2.8 percent to $874,500 for Waterfront homes and 5.2 percent to $616,000 for Non-Waterfront homes. Days on Market increased 4.1 percent for Waterfront homes and 20.8 percent for Non-Waterfront homes. Months Supply of Inventory increased 66.7 percent for Waterfront homes and 44.8 percent for Non-Waterfront homes.

Although sales were up, new listings continued to decline nationwide, sliding 5.1% month-over-month as of last measure, bringing the national sales-to-new listings ratio up from a balanced 50.5% to 57.8%, according to CREA. Inventory was down from the previous month, for a 3.8 months’ supply heading into January. As the market tightens, national sales prices have mostly held steady, with the Aggregate Composite MLS Home Price Index (HPI) falling 0.8% month-over-month. CREA predicts average home prices will rise 2.3% annually, with Alberta and the East Coast expected to see larger price gains this year.
For more information about the Muskoka home sales contact A1 Accurate Appraisal, 3-200 Manitoba St., Suite 329, Bracebridge, ON, Canada, P1L 2E2

Phone: (705) 641-1789 Email: sh***@a1*****************.com please use the contact form here: https://a1accurateappraisal.com/contact-us-secure-page-shawn-oconnor-aaci/ 

More info here: https://a1accurateappraisal.com/monthly-price-ticker-muskoka-real-estate-market-conditions-waterfront-vs-non-waterfront/


Currency Convertor
Currency convertor - Convert the Muskoka waterfront cottage price to your currency
Bank of Canada Website
Find where interest rates may be heading for Muskoka waterfront cottages
Appraisal Institute of Canada
See if your appraiser is a member of the Appraisal Institute of Canada
Toronto Star
Find articles about Muskoka waterfront cottages.

Lorem ipsum dolor sit amet, consectetur adipiscing elit. Ut elit tellus, luctus nec ullamcorper mattis, pulvinar dapibus leo.

2024-1-1 Newsletter: Muskoka Home Sales, Real Estate Trends

Muskoka Market Conditions  January 6, 2024

The median sale price fluctuated during 2023 and reached a high of $744,000 in May, 2023 and a low of $598,000 in December of 2023. The median price data included single family, townhouse, condo and semi-detached dwellings with waterfront. 

Area included in source data for Muskoka home sales: District of Muskoka, residential waterfront improved sales only. (Source: Lakelands Association of Realtors MLS data)

Disclaimer: The above data was provided for personal use only and was obtained from sources considered reliable and was not verified. It is up to the reader of this information is to determine the suitability and use of the information. Any and all liability to the reader is expressly denied

Muskoka Map, Ontario, Canada
Median sale price for Muskoka waterfront homes
$744,000 or $598,000?
$744,000 vs. $598,000
19.62% difference in the median sale price between May 2023 and December 2023.

Muskoka Home Sales

December 2023

National home sales remained mostly stable this period, falling 0.9% month-over-month and 0.9% year-over-year, according to the Canadian Real Estate Association (CREA), as higher borrowing costs continue to impact potential buyers and cause many current homeowners to put their selling plans on hold. Home sales have fallen by about 13% since June, when the Bank of Canada resumed its series of interest rate hikes. Sales are expected to remain cooler through the winter months, with many markets now in the midst of a correction amid higher borrowing costs and historically low affordability. 

New Listings increased 29.1 percent for Waterfront homes and 24.7 percent for Non-Waterfront homes. Sales decreased 24.1 percent for Waterfront homes and 19.6 percent for Non-Waterfront homes. Inventory increased 55.6 percent for Waterfront homes and 45.7 percent for Non-Waterfront homes. 

Median Sales Price increased 16.5 percent to $757,250 for Waterfront homes but decreased 4.1 percent to $618,000 for Non-Waterfront homes. Days on Market increased 42.9 percent for Waterfront homes but decreased 3.8 percent for Non-Waterfront homes. Months Supply of Inventory increased 64.0 percent for Waterfront homes and 59.3 percent for Non-Waterfront homes. 

With home sales down, prices have continued to soften nationwide, falling 1.1% month-over-month as of last report, the largest decline since September 2022, although prices were still up 0.6% year-over-year, according to CREA. Economists are projecting sales prices will continue to soften in parts of Canada until the Bank of Canada begins cutting interest rates, which many expect will occur in 2024, depending on inflation. Meanwhile, the number of new listings declined for the second month in a row, dropping 1.8% from the previous month, for a 4.2 months’ supply heading into December.

For more information about the Muskoka home sales contact A1 Accurate Appraisal, 3-200 Manitoba St., Suite 329, Bracebridge, ON, Canada, P1L 2E2

Phone: (705) 641-1789 Email: sh***@a1*****************.com please use the contact form here: https://a1accurateappraisal.com/contact-us-secure-page-shawn-oconnor-aaci/ 

More info here: https://a1accurateappraisal.com/monthly-price-ticker-muskoka-real-estate-market-conditions-waterfront-vs-non-waterfront/


Currency Convertor
Currency convertor - Convert the Muskoka waterfront cottage price to your currency
Bank of Canada Website
Find where interest rates may be heading for Muskoka waterfront cottages
Appraisal Institute of Canada
See if your appraiser is a member of the Appraisal Institute of Canada
Toronto Star
Find articles about Muskoka waterfront cottages.

2023-11-1, Muskoka Real Estate Market Conditions

Price of a house in Muskoka

Muskoka Market Conditions: The median residential sale price in the District of Muskoka have decreased by 3.60% during the 12 months previous to November 1, 2023 compared to the 12 months previous to November 1, 2022. Sales of vacant land and/or commercial property were not included in the data source.

Area included in source data: District of Muskoka, residential waterfront and residential non-waterfront improved sales only. (Source: Lakelands Association of Realtors MLS data)

Disclaimer: The above data was provided for personal use only and was obtained from sources considered reliable and was not verified. It is up to the reader of this information is to determine the suitability and use of the information. Any and all liability to the reader is expressly denied.

SEE BELOW FOR INTERACTIVE GRAPH SHOWING MEDIAN SALE PRICES FOR NON-WATERFRONT PROPERTIES ONLY.

ROLLING 3 MONTH MEDIAN PRICE – UDATED MONTHLY

September 2023: Canada home sales slid for the second month in a row, falling 4.1% month-over-month, according to the Canadian Real Estate Association (CREA), as higher borrowing costs continue to impact market activity. Economists predicted that sales would soften following the Bank of Canada’s rate hikes this summer, which raised the benchmark interest rate to 5%, a 22-year high, pushing some prospective buyers back to the sidelines, while remaining buyers face significantly higher monthly payments. 

New Listings increased 30.9 percent for Waterfront homes and 17.0 percent for Non-Waterfront homes. Sales increased 16.8 percent for Waterfront homes but decreased 5.5 percent for Non-Waterfront homes. Inventory increased 59.7 percent for Waterfront homes and 26.8 percent for Non-Waterfront homes. 

Median Sales Price decreased 2.7 percent to $860,000 for Waterfront homes and 2.4 percent to $610,000 for Non-Waterfront homes. Days on Market increased 25.6 percent for Waterfront homes and 13.5 percent for Non-Waterfront homes. Months Supply of Inventory increased 91.1 percent for Waterfront homes and 50.0 percent for Non-Waterfront homes. 

As sales slow, new listings continue to rise, climbing 0.8% month-over-month, according to CREA. New listings are up a cumulative 24% since March, after reaching a two-decade low at the beginning of the year. Although buyers may have additional options in their home search, inventory remains low by historical standards, with only 3.4 months’ supply heading into September. Supply and demand imbalances have put upward pressure on sales prices, which have continued to rise nationally, with the MLS Home Price Index (HPI) increasing 0.4% as of last measure.

More info here: https://a1accurateappraisal.com/2023-10-1-newsletter-muskoka-home-sales-real-estate-trends/

Waterfront price trends here: https://a1accurateappraisal.com/new-waterfront-home-prices-muskoka-on-ca-data-updated-monthly/

Currency Convertor
Currency convertor - Convert the Muskoka waterfront cottage price to your currency
Bank of Canada Website
Find where interest rates may be heading for Muskoka waterfront cottages
Appraisal Institute of Canada
See if your appraiser is a member of the Appraisal Institute of Canada
Toronto Star
Find articles about Muskoka waterfront cottages.

2023-10-1 Newsletter: Muskoka Home Sales, Real Estate Trends

Muskoka Market Conditions  October 1, 2023

Muskoka Home Sales and Muskoka Market Conditions: The median residential sale price in the District of Muskoka increased by approximately 13.32 % during the 12 months previous to October 1, 2023 compared to the 12 months previous to October 1, 2022. Sales of vacant land and/or commercial property were not included in the data source for Muskoka home sales.

Area included in source data for Muskoka home sales: District of Muskoka, residential waterfront and residential non-waterfront improved sales only. (Source: Lakelands Association of Realtors MLS data)

Disclaimer: The above data was provided for personal use only and was obtained from sources considered reliable and was not verified. It is up to the reader of this information is to determine the suitability and use of the information. Any and all liability to the reader is expressly denied

Muskoka Map, Ontario, Canada
Muskoka Home Prices

The aggregate median sale price for waterfront and non-waterfront property together has recently been increasing and was $702,000 as at October 1, 2023. (12 month rolling aggregate median price). 

Muskoka Home Sales

Median Real Estate Sale Price in Muskoka, Ontario, Canada.

September 2023: Canada home sales slid for the second month in a row, falling 4.1% month-over-month, according to the Canadian Real Estate Association (CREA), as higher borrowing costs continue to impact market activity. Economists predicted that sales would soften following the Bank of Canada’s rate hikes this summer, which raised the benchmark interest rate to 5%, a 22-year high, pushing some prospective buyers back to the sidelines, while remaining buyers face significantly higher monthly payments. 

New Listings increased 30.9 percent for Waterfront homes and 17.0 percent for Non-Waterfront homes. Sales increased 16.8 percent for Waterfront homes but decreased 5.5 percent for Non-Waterfront homes. Inventory increased 59.7 percent for Waterfront homes and 26.8 percent for Non-Waterfront homes. 

Median Sales Price decreased 2.7 percent to $860,000 for Waterfront homes and 2.4 percent to $610,000 for Non-Waterfront homes. Days on Market increased 25.6 percent for Waterfront homes and 13.5 percent for Non-Waterfront homes. Months Supply of Inventory increased 91.1 percent for Waterfront homes and 50.0 percent for Non-Waterfront homes. 

As sales slow, new listings continue to rise, climbing 0.8% month-over-month, according to CREA. New listings are up a cumulative 24% since March, after reaching a two-decade low at the beginning of the year. Although buyers may have additional options in their home search, inventory remains low by historical standards, with only 3.4 months’ supply heading into September. Supply and demand imbalances have put upward pressure on sales prices, which have continued to rise nationally, with the MLS Home Price Index (HPI) increasing 0.4% as of last measure.

For more information about the Muskoka home sales contact A1 Accurate Appraisal, 3-200 Manitoba St., Suite 329, Bracebridge, ON, Canada, P1L 2E2

Phone: (705) 641-1789 Email: sh***@a1*****************.com

More info here  https://a1accurateappraisal.com/2023-10-1-muskoka-market-conditions/ 

Currency Convertor
Currency convertor - Convert the Muskoka waterfront cottage price to your currency
Bank of Canada Website
Find where interest rates may be heading for Muskoka waterfront cottages
Appraisal Institute of Canada
See if your appraiser is a member of the Appraisal Institute of Canada
Toronto Star
Find articles about Muskoka waterfront cottages.

2023-10-1, Muskoka Real Estate Market Conditions

Is my house worth more this year?

Muskoka Market Conditions: The median residential sale price in the District of Muskoka increased by approximately 12.2 % during the 12 months previous to October 1, 2023 compared to the 12 months previous to October 1, 2022. Sales of vacant land and/or commercial property were not included in the data source.

Area included in source data: District of Muskoka, residential waterfront and residential non-waterfront improved sales only. (Source: Lakelands Association of Realtors MLS data)

Disclaimer: The above data was provided for personal use only and was obtained from sources considered reliable and was not verified. It is up to the reader of this information is to determine the suitability and use of the information. Any and all liability to the reader is expressly denied.

September 2023: Canada home sales slid for the second month in a row, falling 4.1% month-over-month, according to the Canadian Real Estate Association (CREA), as higher borrowing costs continue to impact market activity. Economists predicted that sales would soften following the Bank of Canada’s rate hikes this summer, which raised the benchmark interest rate to 5%, a 22-year high, pushing some prospective buyers back to the sidelines, while remaining buyers face significantly higher monthly payments. 

New Listings increased 30.9 percent for Waterfront homes and 17.0 percent for Non-Waterfront homes. Sales increased 16.8 percent for Waterfront homes but decreased 5.5 percent for Non-Waterfront homes. Inventory increased 59.7 percent for Waterfront homes and 26.8 percent for Non-Waterfront homes. 

Median Sales Price decreased 2.7 percent to $860,000 for Waterfront homes and 2.4 percent to $610,000 for Non-Waterfront homes. Days on Market increased 25.6 percent for Waterfront homes and 13.5 percent for Non-Waterfront homes. Months Supply of Inventory increased 91.1 percent for Waterfront homes and 50.0 percent for Non-Waterfront homes. 

As sales slow, new listings continue to rise, climbing 0.8% month-over-month, according to CREA. New listings are up a cumulative 24% since March, after reaching a two-decade low at the beginning of the year. Although buyers may have additional options in their home search, inventory remains low by historical standards, with only 3.4 months’ supply heading into September. Supply and demand imbalances have put upward pressure on sales prices, which have continued to rise nationally, with the MLS Home Price Index (HPI) increasing 0.4% as of last measure.

More info here: https://a1accurateappraisal.com/2023-10-1-newsletter-muskoka-home-sales-real-estate-trends/

Waterfront price trends here: https://a1accurateappraisal.com/new-waterfront-home-prices-muskoka-on-ca-data-updated-monthly/

Currency Convertor
Currency convertor - Convert the Muskoka waterfront cottage price to your currency
Bank of Canada Website
Find where interest rates may be heading for Muskoka waterfront cottages
Appraisal Institute of Canada
See if your appraiser is a member of the Appraisal Institute of Canada
Toronto Star
Find articles about Muskoka waterfront cottages.

2023-8-1 Newsletter Muskoka Real Estate Trends

Muskoka Market Conditions August 2023

Muskoka Market Conditions: The median residential sale price in the District of Muskoka increased by approximately 1.31 % during the 12 months previous to August 1, 2023 compared to the 12 months previous to August 1, 2022. Sales of vacant land and/or commercial property were not included in the data source.

Area included in source data: District of Muskoka, residential waterfront and residential non-waterfront improved sales only. (Source: Lakelands Association of Realtors MLS data)

Disclaimer: The above data was provided for personal use only and was obtained from sources considered reliable and was not verified. It is up to the reader of this information is to determine the suitability and use of the information. Any and all liability to the reader is expressly denied.

Muskoka Map, Ontario, Canada

The aggregate median sale price for waterfront and non-waterfront property together has recently been increasing and was $681,250 as at August 1, 2023. (12 month rolling aggregate median price). Both  waterfront and non-waterfront home prices have increased in the last month (July). 

July 2023: National home sales continue to improve, rising 1.5% month-over-month as of last measure, according to the Canadian Real Estate Association (CREA), with sales up 4.7% compared to the same period last year. Market activity has picked up in recent months as homebuyers took advantage of the Bank of Canada’s temporary pause on interest rate hikes earlier this year, leading home sales to increase ahead of the Bank’s latest 0.25% rate hike in July.

New Listings increased 10.2 percent for Waterfront homes and 1.6 percent for Non-Waterfront homes. Sales decreased 20.5 percent for Waterfront homes but increased 27.3 percent for Non-Waterfront homes. Inventory increased 41.5 percent for Waterfront homes and 19.6 percent for Non-Waterfront homes. 

Median Sales Price increased 15.2 percent to $980,000 for Waterfront homes and 1.7 percent to $660,000 for Non-Waterfront homes. Days on Market increased 34.5 percent for Waterfront homes and 46.2 percent for Non-Waterfront homes. Months Supply of Inventory increased 100.0 percent for Waterfront homes and 54.1 percent for Non-Waterfront homes. 

Sellers appear to be taking note of the recent surge of buyer activity, with new listings climbing 5.9% month-over-month, according to CREA, building on the increases recorded in April and May. A new wave of listings has helped give prospective buyers additional options in their home search, but with only 3.1 months’ supply heading into July, low inventory levels continue to put upward pressure on home prices, with the Aggregate Composite Home Price Index (HPI) rising 2% month-over-month, a significant increase for a single month.

For more information about the Muskoka market contact A1 Accurate Appraisal, 3-200 Manitoba St., Suite 329, Bracebridge, ON, Canada, P1L 2E2

Phone: (705) 641-1789 Email: sh***@a1*****************.com

2023-8-1, Muskoka Market Conditions

Muskoka real estate prices

Muskoka Market Conditions: The median residential sale price in the District of Muskoka increased by approximately 1.31 % during the 12 months previous to August 1, 2023 compared to the 12 months previous to August 1, 2022. Sales of vacant land and/or commercial property were not included in the data source.

Area included in source data: District of Muskoka, residential waterfront and residential non-waterfront improved sales only. (Source: Lakelands Association of Realtors MLS data)

Disclaimer: The above data was provided for personal use only and was obtained from sources considered reliable and was not verified. It is up to the reader of this information is to determine the suitability and use of the information. Any and all liability to the reader is expressly denied.

2023-7-1 Newsletter Muskoka Real Estate Trends

Muskoka Market Conditions July 2023

Muskoka Market Conditions: The median residential sale price in the District of Muskoka decreased by approximately 5.17% during the 12 months previous to July 1, 2023 compared to the 12 months previous to July 1, 2022. Sales of vacant land and/or commercial property were not included in the data source.

Area included in source data: District of Muskoka, residential waterfront and residential non-waterfront improved sales only. (Source: Lakelands Association of Realtors MLS data)

Disclaimer: The above data was provided for personal use only and was obtained from sources considered reliable and was not verified. It is up to the reader of this information is to determine the suitability and use of the information. Any and all liability to the reader is expressly denied.

Muskoka Map, Ontario, Canada

The aggregate median sale price for waterfront and non-waterfront property together has recently been declining and was $680,000 as at July 1, 2023. (12 month rolling aggregate median price). Both  waterfront and non-waterfront home prices have declined last month. 

May 2023: The Canada real estate market continues to show signs of a rebound, with home sales up by double digits month-over-month. According to the Canadian Real Estate Association (CREA), national home sales rose 11.3% as of last measure, marking the third consecutive month that home sales grew, and the strongest monthly gain in nearly three years. While buyers have returned to the market, the rise in mortgage interest rates over the last year has kept many current homeowners on the sidelines, with new listings up 1.6% month-over-month. 

New Listings increased 15.0 percent for Waterfront homes but decreased 3.2 percent for Non-Waterfront homes. Sales decreased 2.5 percent for Waterfront homes but increased 2.9 percent for Non-Waterfront homes. Inventory increased 56.6 percent for Waterfront homes and 41.8 percent for Non-Waterfront homes. 

Median Sales Price decreased 2.6 percent to $950,000 for Waterfront homes and 3.7 percent to $681,500 for Non-Waterfront homes. Days on Market increased 93.8 percent for Waterfront homes and 106.7 percent for Non-Waterfront homes. Months Supply of Inventory increased 153.1 percent for Waterfront homes and 121.7 percent for Non-Waterfront homes. 

Buyer demand continues to outpace supply, which remains at a two decade low, causing sales prices to increase for the second straight month. According to CREA, the Aggregate Composite MLS Home Price Index (HPI) rose 1.6% month-over-month as of last measure, with the national average sales price up more than $100,000 since January. Although home prices remain down compared to last year, recent increases could help bring prospective sellers back to the market, many of whom have been delaying the decision to sell until market conditions shift in their favor.

For more information about the Muskoka market contact A1 Accurate Appraisal, 3-200 Manitoba St., Suite 329, Bracebridge, ON, Canada, P1L 2E2

Phone: (705) 641-1789 Email: sh***@a1*****************.com

2023-7-1, Muskoka Market Conditions

Muskoka Market Conditions: The median residential sale price in the District of Muskoka decreased by approximately 5.17% during the 12 months previous to July 1, 2023 compared to the 12 months previous to July 1, 2022. Sales of vacant land and/or commercial property were not included in the data source.

Area included in source data: District of Muskoka, residential waterfront and residential non-waterfront improved sales only. (Source: Lakelands Association of Realtors MLS data)

Disclaimer: The above data was provided for personal use only and was obtained from sources considered reliable and was not verified. It is up to the reader of this information is to determine the suitability and use of the information. Any and all liability to the reader is expressly denied.

2023-7-1 Newsletter Muskoka Real Estate Trends

Muskoka Market Conditions May 2023

Muskoka Market Conditions: The median residential sale price in the District of Muskoka decreased by approximately 9.01% during the 12 months previous to May 2023 compared to the 12 months previous to May 2022. Sales of vacant land and/or commercial property were not included in the data source

Area included in source data: District of Muskoka, residential waterfront and residential non-waterfront improved sales only. (Source: Lakelands Association of Realtors MLS data)

Disclaimer: The information and data in this newsletter is provided for personal use only and was obtained from sources considered reliable and was not verified. It is up to the reader of this information is to determine the suitability and use of the information. Any and all liability to the reader is expressly denied.

Muskoka Map, Ontario, Canada

The aggregate median sale price for waterfront and non-waterfront property together has recently been rising and was $677,500 at May 1, 2023. (12 month rolling aggregate median price) Waterfront home prices have declined last month while non-waterfront home sales showed a slight increase from $585,500 to $590,000

Median Sale Prices
Muskoka, ON, CA- 2023-5-1 Percent of List Price Received
Quick Facts on Muskoka Home Sales

HOUSING SUPPLY – March 2023

March 2023 The Canada housing market downturn may be easing up, and recent data from the Royal Bank of Canada (RBC) suggests the Bank is feeling increasingly optimistic about the future of the market. In March, RBC announced a conditional pause on interest rate hikes, marking the first time in over a year that rates have not increased. Although home prices remain elevated by historical standards, the Bank’s decision should help ease fears of additional rate hikes in the short term and encourage some buyers to return to the market, with home sales expected to increase as the year progresses.

New Listings increased 44.9 percent for Waterfront homes and 2.9 percent for Non-Waterfront homes. Sales decreased 25.3 percent for Waterfront homes and 35.9 percent for Non-Waterfront homes. Inventory increased 141.2 percent for Waterfront homes and 158.6 percent for Non-Waterfront homes.

Median Sales Price decreased 15.7 percent to $970,000 for Waterfront homes and 16.9 percent to $644,000 for Non-Waterfront homes. Days on Market increased 83.3 percent for Waterfront homes and 171.4 percent for Non-Waterfront homes. Months Supply of Inventory increased 360.0 percent for Waterfront homes and 333.3 percent for Non-Waterfront homes.

Market activity has begun to pick up heading into spring, with national home sales rising 2.3% month-over-month as of last measure, according to the Canadian Real Estate Association (CREA). CREA reports that sales activity has returned to pre-pandemic levels for the same period, although inventory remains limited at 4.1 months, with new listings down 7.9% month-over-month. Meanwhile, home price growth has continued to slow, with the Aggregate Composite MLS Home Price Index (HPI) falling 1.1% from the previous month, marking the twelfth consecutive month home prices have declined.

For more information about the Muskoka market contact A1 Accurate Appraisal, 3-200 Manitoba St., Suite 329, Bracebridge, ON, Canada, P1L 2E2

Phone: (705) 641-1789 Email: sh***@a1*****************.com