Muskoka Market Conditions May 2023
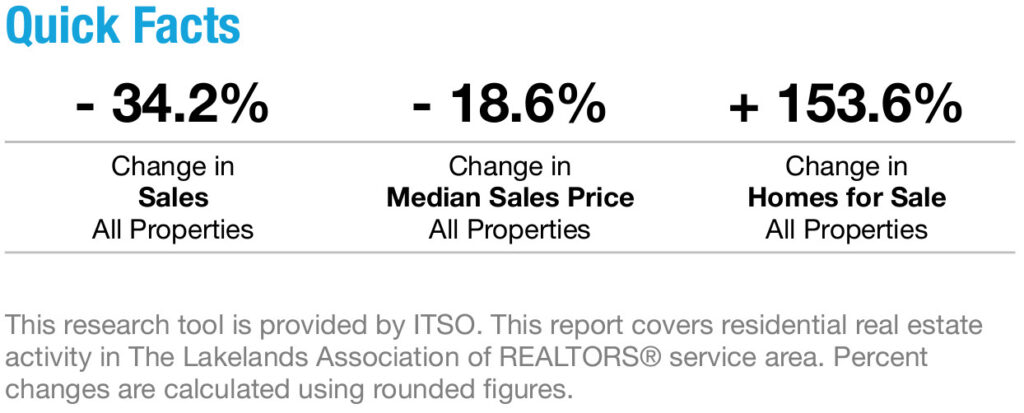
Muskoka Market Conditions: The median residential sale price in the District of Muskoka decreased by approximately 9.01% during the 12 months previous to May 2023 compared to the 12 months previous to May 2022. Sales of vacant land and/or commercial property were not included in the data source
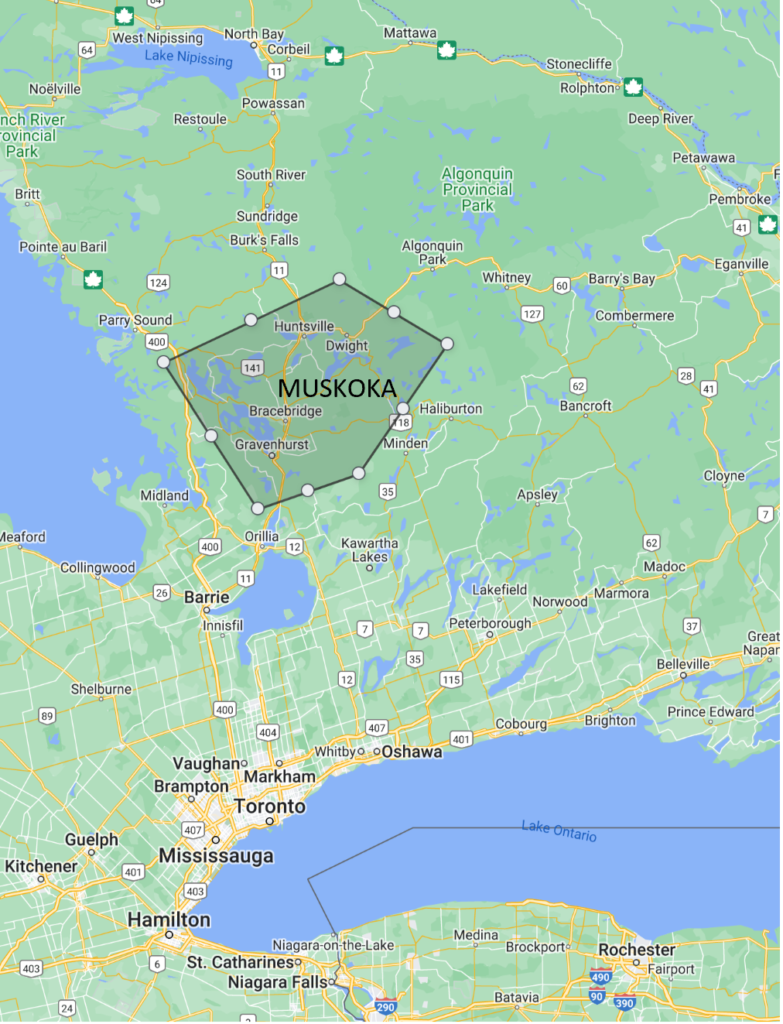
Area included in source data: District of Muskoka, residential waterfront and residential non-waterfront improved sales only. (Source: Lakelands Association of Realtors MLS data)
Disclaimer: The information and data in this newsletter is provided for personal use only and was obtained from sources considered reliable and was not verified. It is up to the reader of this information is to determine the suitability and use of the information. Any and all liability to the reader is expressly denied.


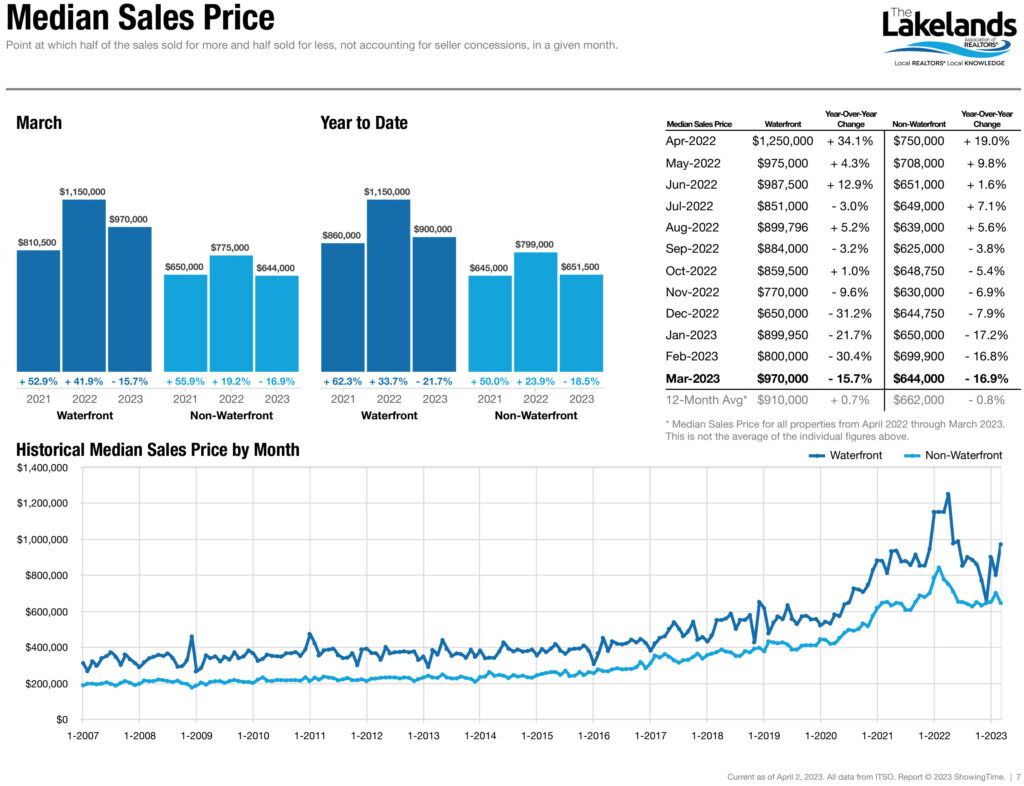
The aggregate median sale price for waterfront and non-waterfront property together has recently been rising and was $677,500 at May 1, 2023. (12 month rolling aggregate median price) Waterfront home prices have declined last month while non-waterfront home sales showed a slight increase from $585,500 to $590,000


HOUSING SUPPLY – March 2023
March 2023 The Canada housing market downturn may be easing up, and recent data from the Royal Bank of Canada (RBC) suggests the Bank is feeling increasingly optimistic about the future of the market. In March, RBC announced a conditional pause on interest rate hikes, marking the first time in over a year that rates have not increased. Although home prices remain elevated by historical standards, the Bank’s decision should help ease fears of additional rate hikes in the short term and encourage some buyers to return to the market, with home sales expected to increase as the year progresses.
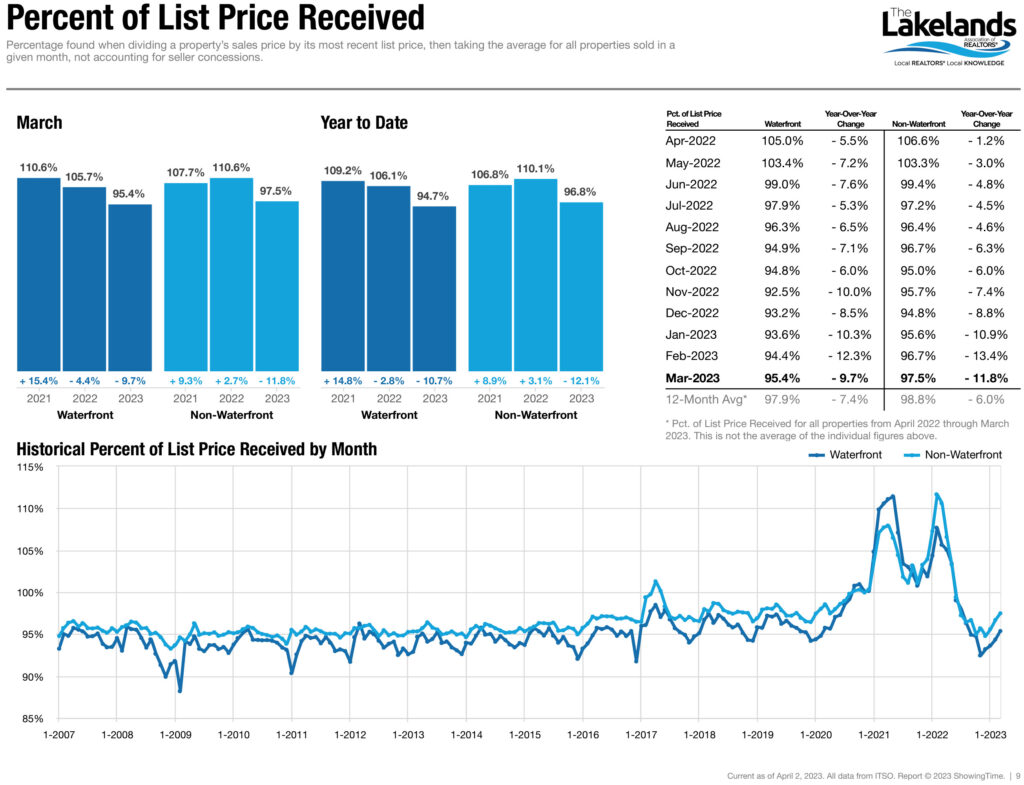
New Listings increased 44.9 percent for Waterfront homes and 2.9 percent for Non-Waterfront homes. Sales decreased 25.3 percent for Waterfront homes and 35.9 percent for Non-Waterfront homes. Inventory increased 141.2 percent for Waterfront homes and 158.6 percent for Non-Waterfront homes.
Median Sales Price decreased 15.7 percent to $970,000 for Waterfront homes and 16.9 percent to $644,000 for Non-Waterfront homes. Days on Market increased 83.3 percent for Waterfront homes and 171.4 percent for Non-Waterfront homes. Months Supply of Inventory increased 360.0 percent for Waterfront homes and 333.3 percent for Non-Waterfront homes.
Market activity has begun to pick up heading into spring, with national home sales rising 2.3% month-over-month as of last measure, according to the Canadian Real Estate Association (CREA). CREA reports that sales activity has returned to pre-pandemic levels for the same period, although inventory remains limited at 4.1 months, with new listings down 7.9% month-over-month. Meanwhile, home price growth has continued to slow, with the Aggregate Composite MLS Home Price Index (HPI) falling 1.1% from the previous month, marking the twelfth consecutive month home prices have declined.
For more information about the Muskoka market contact A1 Accurate Appraisal, 3-200 Manitoba St., Suite 329, Bracebridge, ON, Canada, P1L 2E2
Phone: (705) 641-1789 Email: