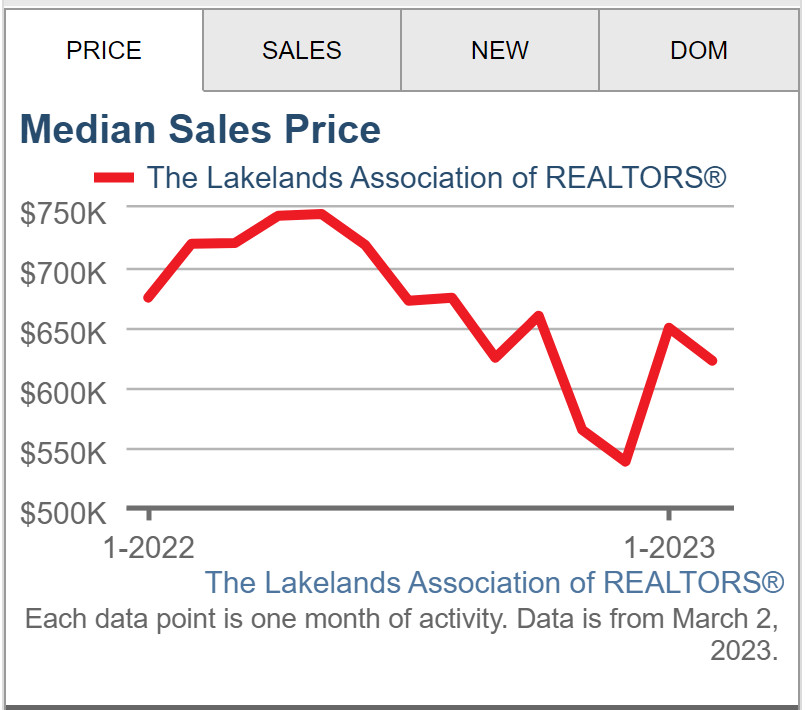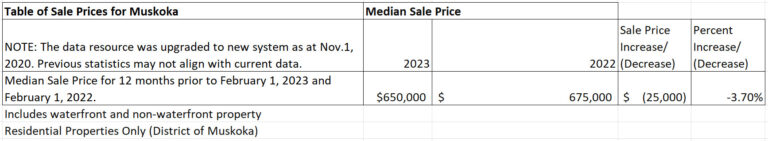
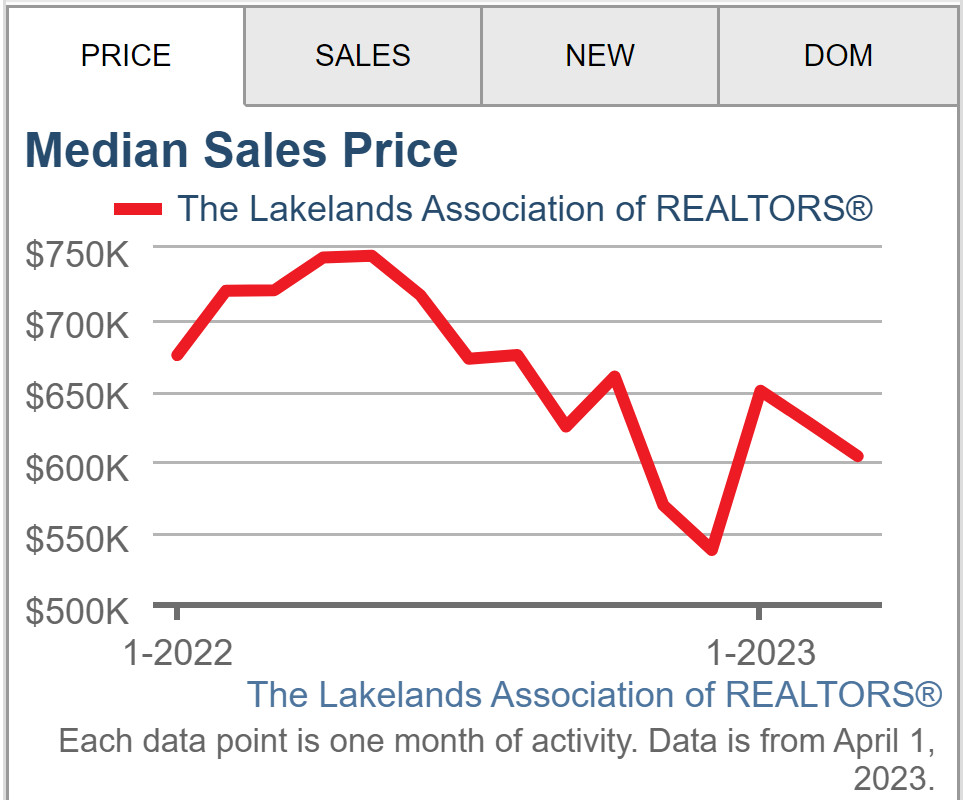
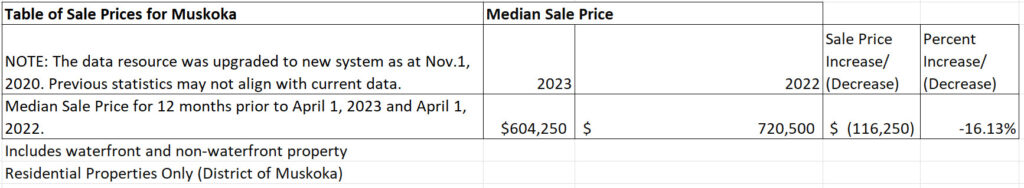
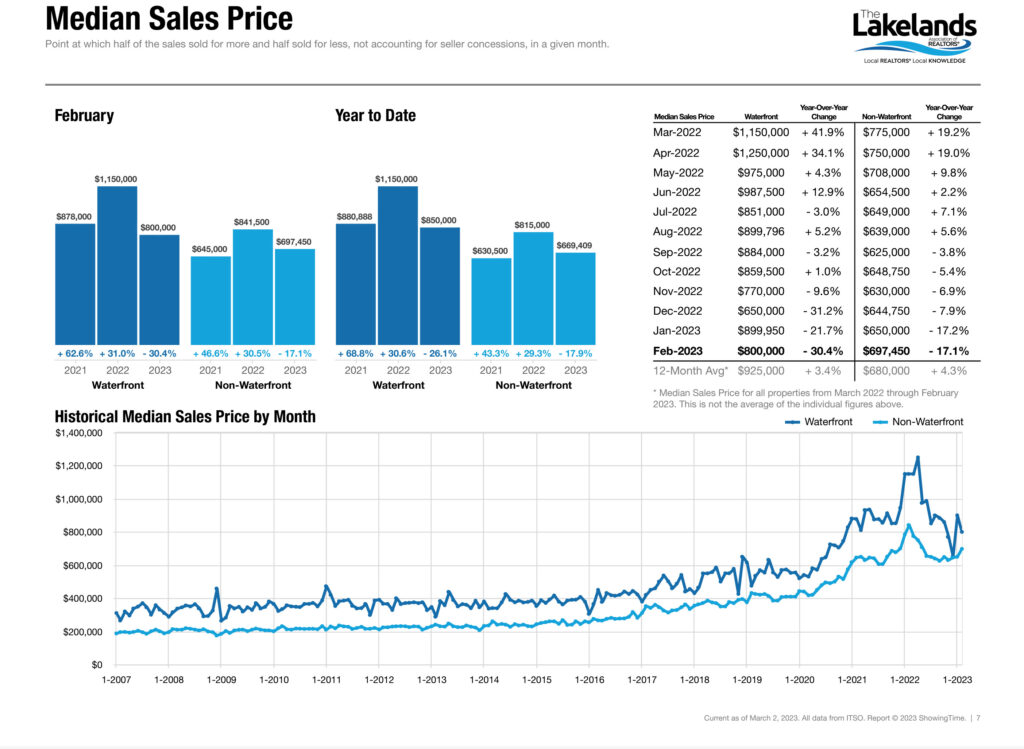
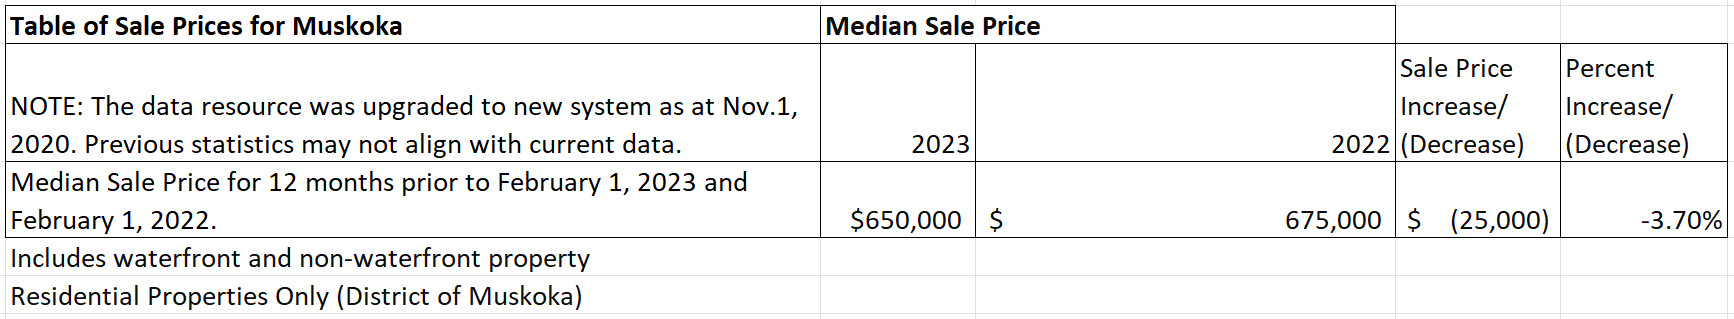
Muskoka Market Conditions: The median residential sale price in the District of Muskoka decreased by approximately 3.70% during the 12 months previous to February 2023 compared to the 12 months previous to February 2022. Sales of vacant land and/or commercial property were not included in the data source.
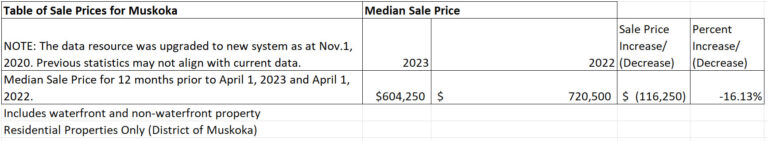
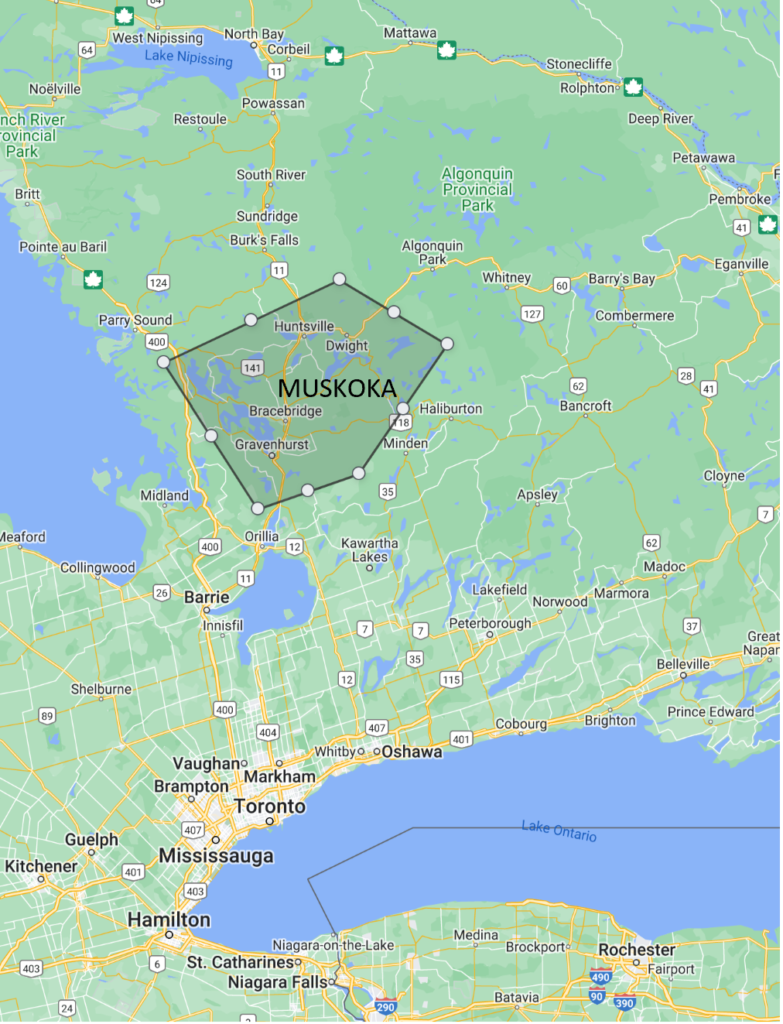
Area included in source data: District of Muskoka, residential waterfront and residential non-waterfront improved sales only. (Source: Lakelands Association of Realtors MLS data)
Disclaimer: The above data was provided for personal use only and was obtained from sources considered reliable and was not verified. It is up to the reader of this information is to determine the suitability and use of the information. Any and all liability to the reader is expressly denied.
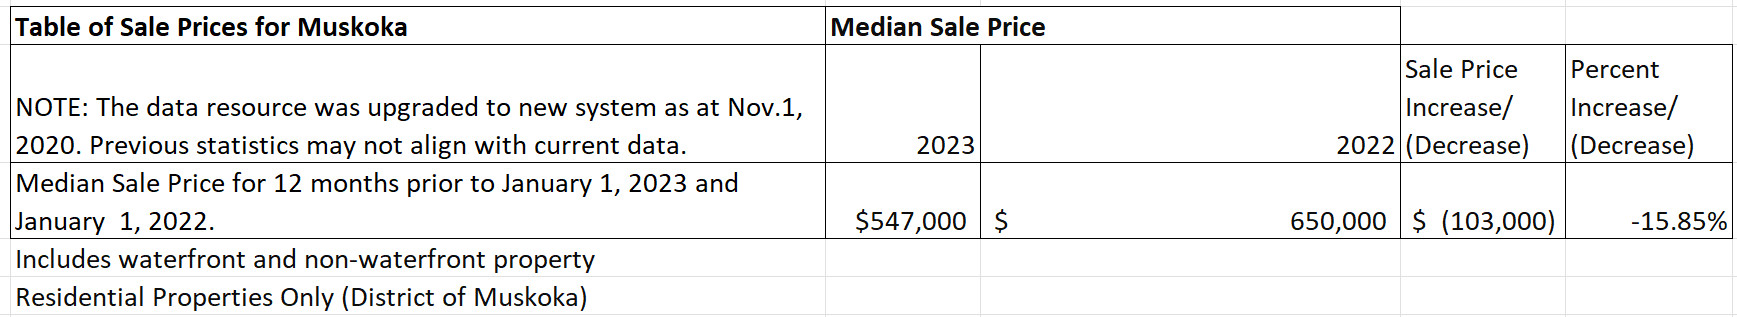
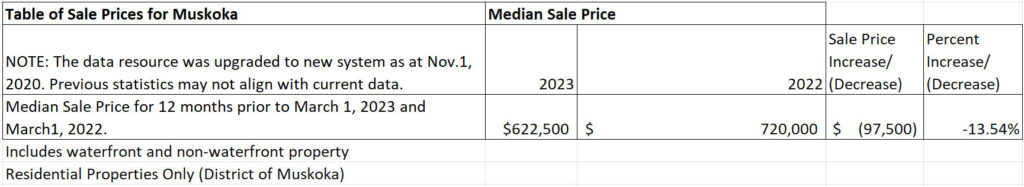
Muskoka Market Conditions: The median residential sale price in the District of Muskoka decreased by approximately 15.85% during the 12 months previous to January 2023 compared to the 12 months previous to January 2022. Sales of vacant land and/or commercial property were not included in the data source.
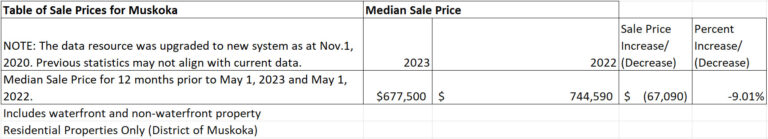
Area included in source data: District of Muskoka, residential waterfront and residential non-waterfront improved sales only. (Source: Lakelands Association of Realtors MLS data)
Disclaimer: The above data was provided for personal use only and was obtained from sources considered reliable and was not verified. It is up to the reader of this information is to determine the suitability and use of the information. Any and all liability to the reader is expressly denied.
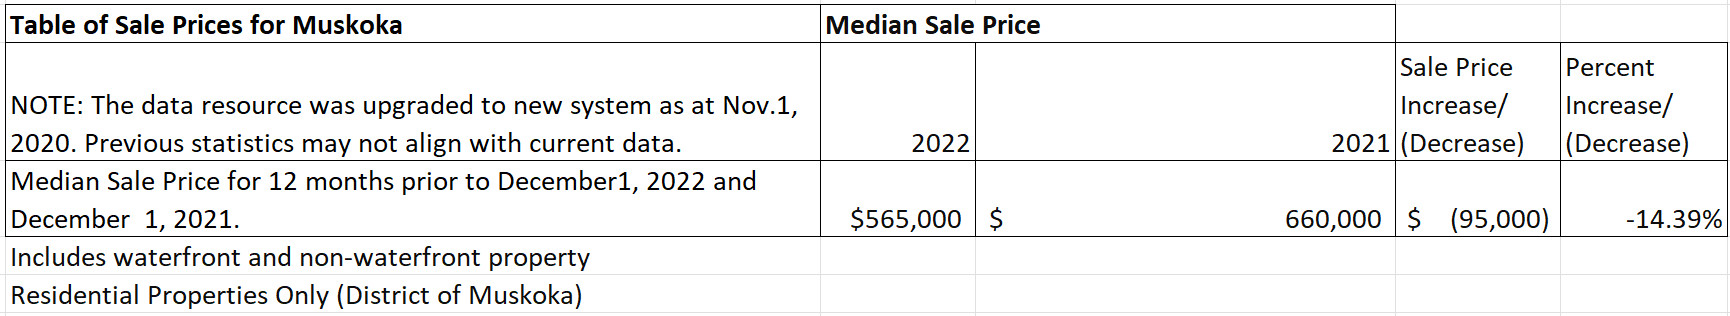
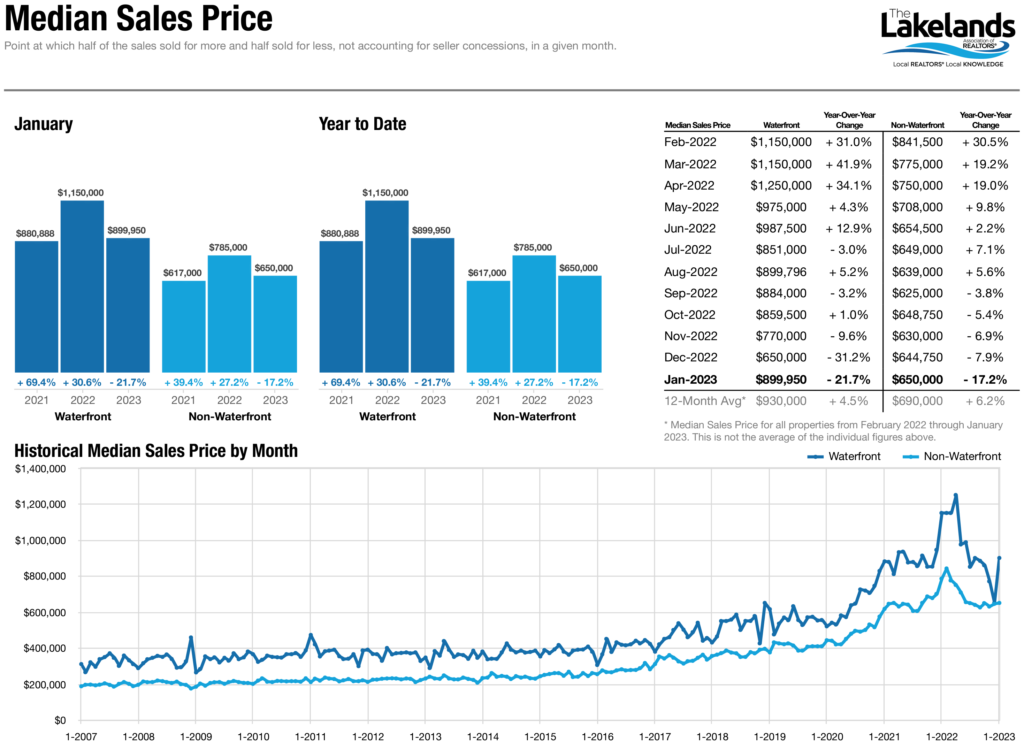
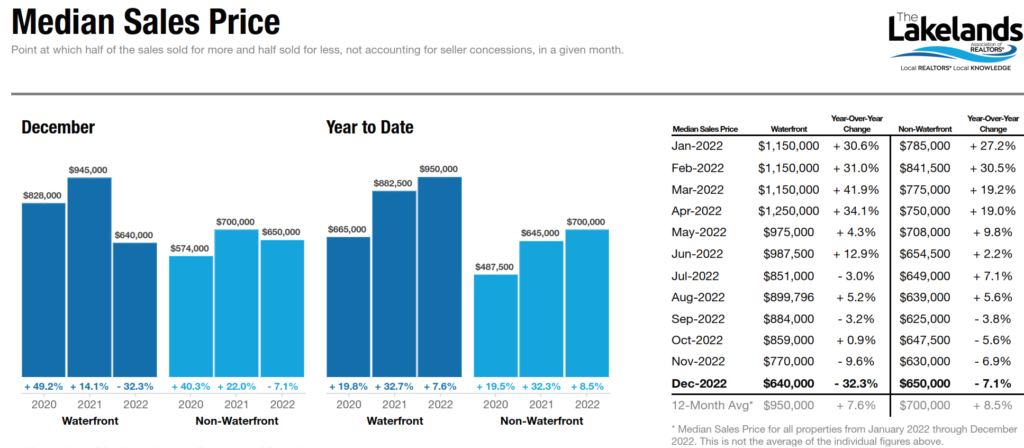
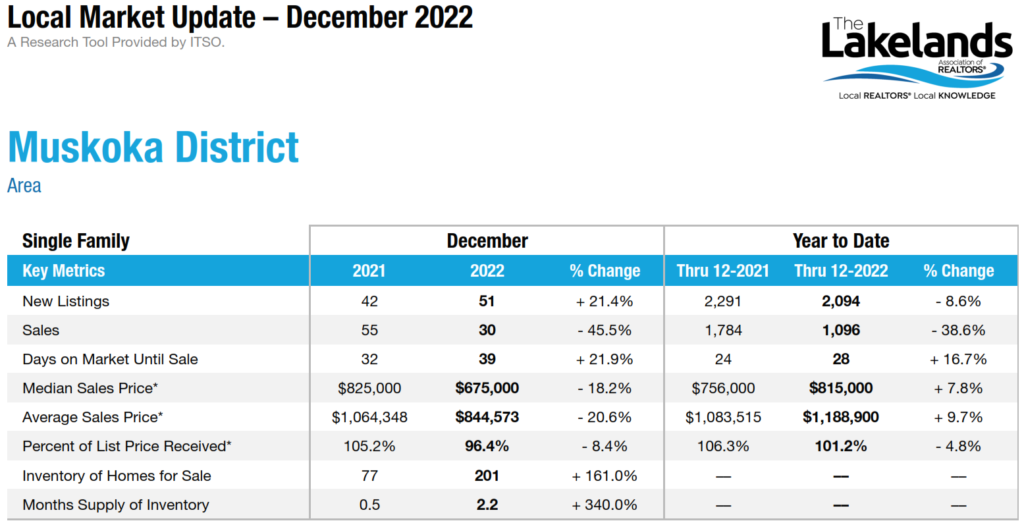
Muskoka Market Conditions: The median residential sale price in the District of Muskoka decreased by approximately 14.39% during the 12 months previous to December 2022 compared to the 12 months previous to December 2021. Sales of vacant land and/or commercial property were not included in the data source.
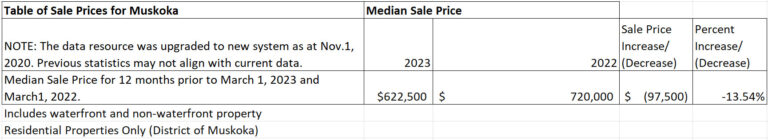
Area included in source data: District of Muskoka, residential waterfront and residential non-waterfront improved sales only. (Source: Lakelands Association of Realtors MLS data)
Disclaimer: The above data was provided for personal use only and was obtained from sources considered reliable and was not verified. It is up to the reader of this information is to determine the suitability and use of the information. Any and all liability to the reader is expressly denied.