Muskoka Market Conditions April 2023
Muskoka Market Conditions: The median residential sale price in the District of Muskoka decreased by approximately 16.13.% during the 12 months previous to April 2023 compared to the 12 months previous to April 2022. Sales of vacant land and/or commercial property were not included in the data source.
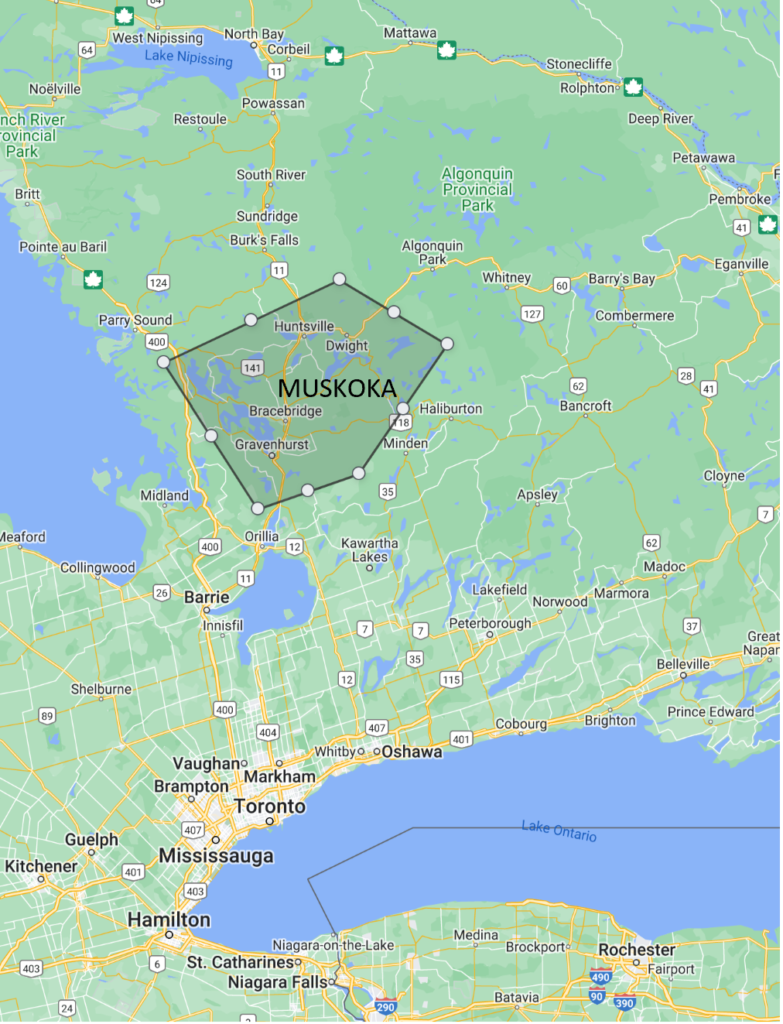
Area included in source data: District of Muskoka, residential waterfront and residential non-waterfront improved sales only. (Source: Lakelands Association of Realtors MLS data)
Disclaimer: The information and data in this newsletter is provided for personal use only and was obtained from sources considered reliable and was not verified. It is up to the reader of this information is to determine the suitability and use of the information. Any and all liability to the reader is expressly denied.
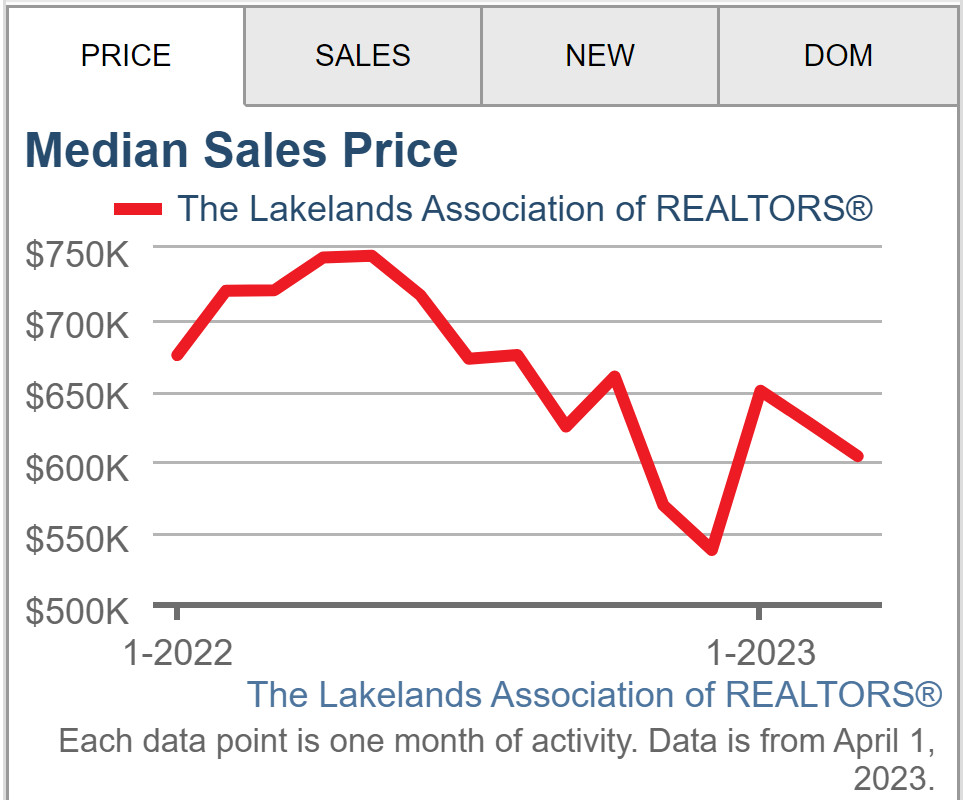
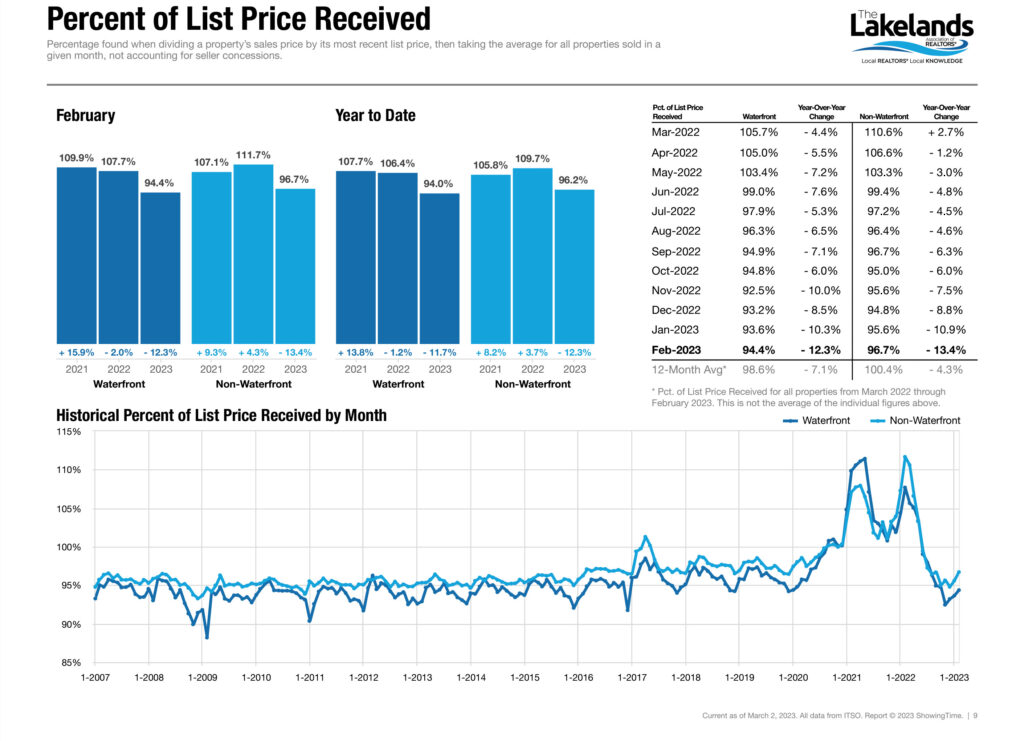
The aggregate median sale price for waterfront and non-waterfront property together has recently been decreasing and was $604,250 at April 1, 2023. (12 month rolling aggregate median price) Waterfront home prices are increasing while non-waterfront home sales continue to show price declines.

HOUSING SUPPLY – February 2023
After a slight increase last period, national home sales declined again, falling 3% month-over-month as of last measure, according to the Canada Real Estate Association (CREA). Affordability challenges continue to constrain market activity, as elevated home prices and rising interest rates limit the number of eligible buyers and cut into purchasing power. As a result, many would-be buyers have turned to the rental market, where monthly rents continue to hit record highs across the country due to limited supply and a surging demand.
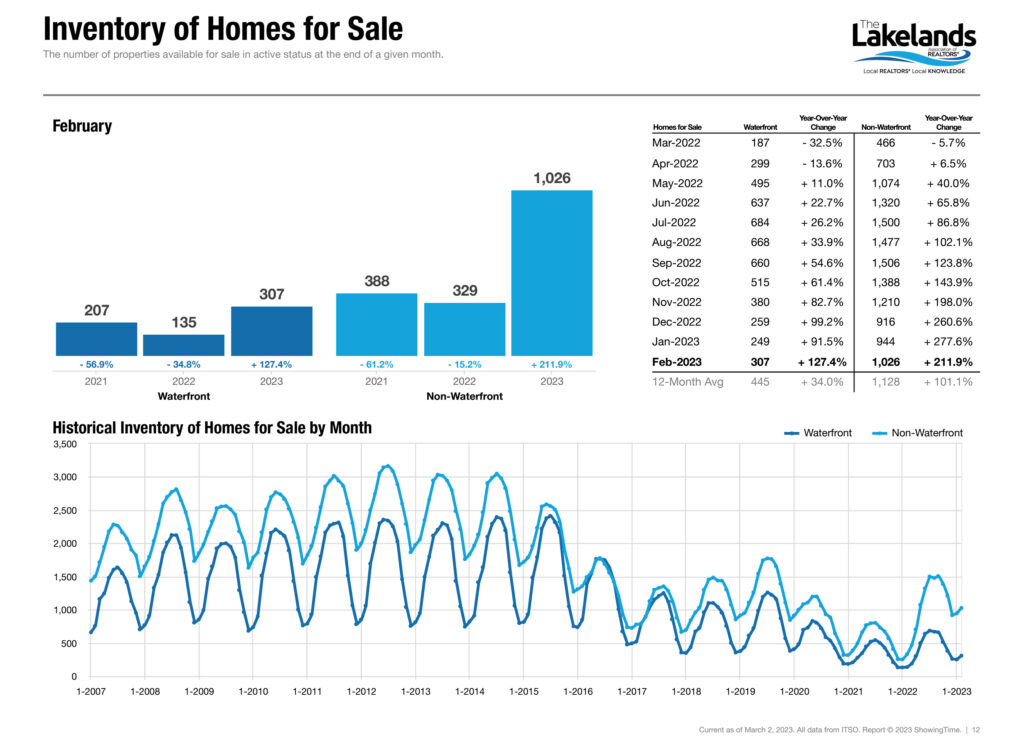
New Listings increased 29.5 percent for Waterfront homes and 2.1 percent for Non-Waterfront homes. Sales decreased 59.8 percent for Waterfront homes and 40.4 percent for Non-Waterfront homes. Inventory increased 127.4 percent for Waterfront homes and 211.9 percent for Non-Waterfront homes.
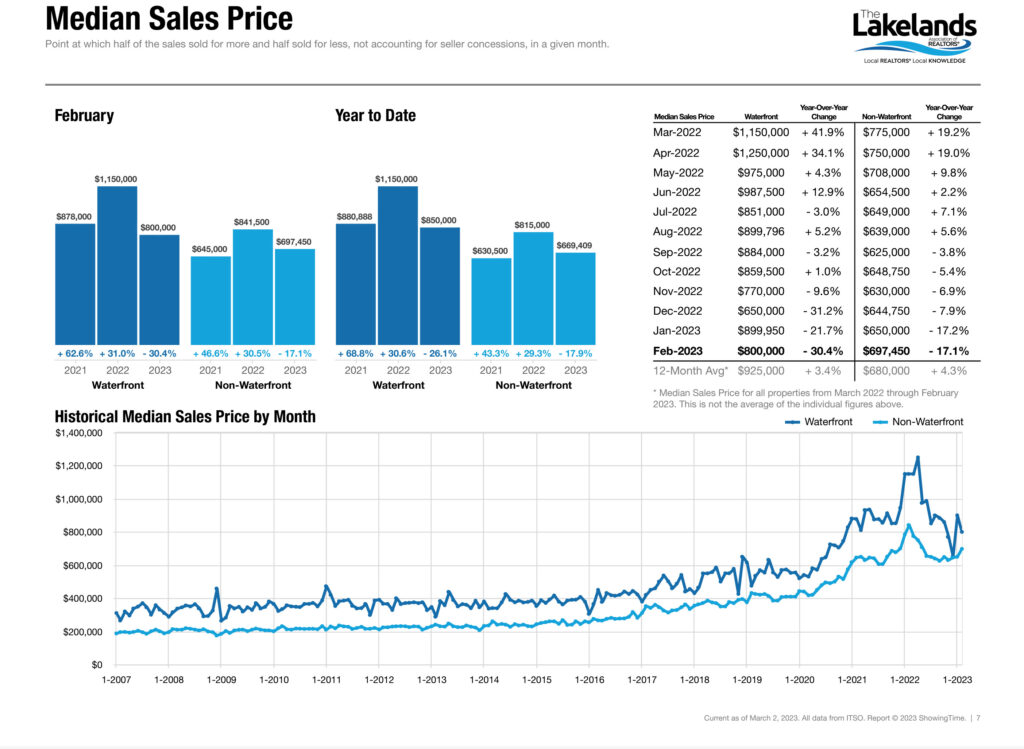
Median Sales Price decreased 30.4 percent to $800,000 for Waterfront homes and 17.1 percent to $697,450 for Non-Waterfront homes. Days on Market increased 67.7 percent for Waterfront homes and 193.3 percent for Non-Waterfront homes. Months Supply of Inventory increased 342.9 percent for Waterfront homes and 433.3 percent for Non-Waterfront homes.
The slowdown in home sales has helped housing supply increase, with 4.3 months’ supply of inventory nationally heading into February. Although still below the long-term average of 5 months, the current supply of homes is close to where it measured in the months prior to the COVID-19 pandemic lockdown. The decline in sales is also reflected in softening home prices, which have fallen for 11 consecutive months, with the Aggregate Composite MLS Home Price Index (HPI) now 15% below its peak level in February 2022, according to CREA.
For more information about the Muskoka market contact A1 Accurate Appraisal, 3-200 Manitoba St., Suite 329, Bracebridge, ON, Canada, P1L 2E2
Phone: (705) 641-1789 Email: